EXPLORE WATER

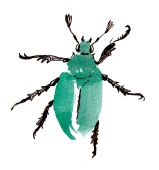
PLANKTON
This will definitely be easier in schools equipped with microscopes, binocular magnifiers and possibly the technology to project images of the samples on microscope slides onto the wall or computer screen. The focus of this year’s School Grounds Month will be on the diversity of plankton and we will be watching and observing zooplankton, algae and cyanobacteria.

Goal: Discover what even very small things live in the water.
Time:
Age: grades for ages 11–14
Subject: biology
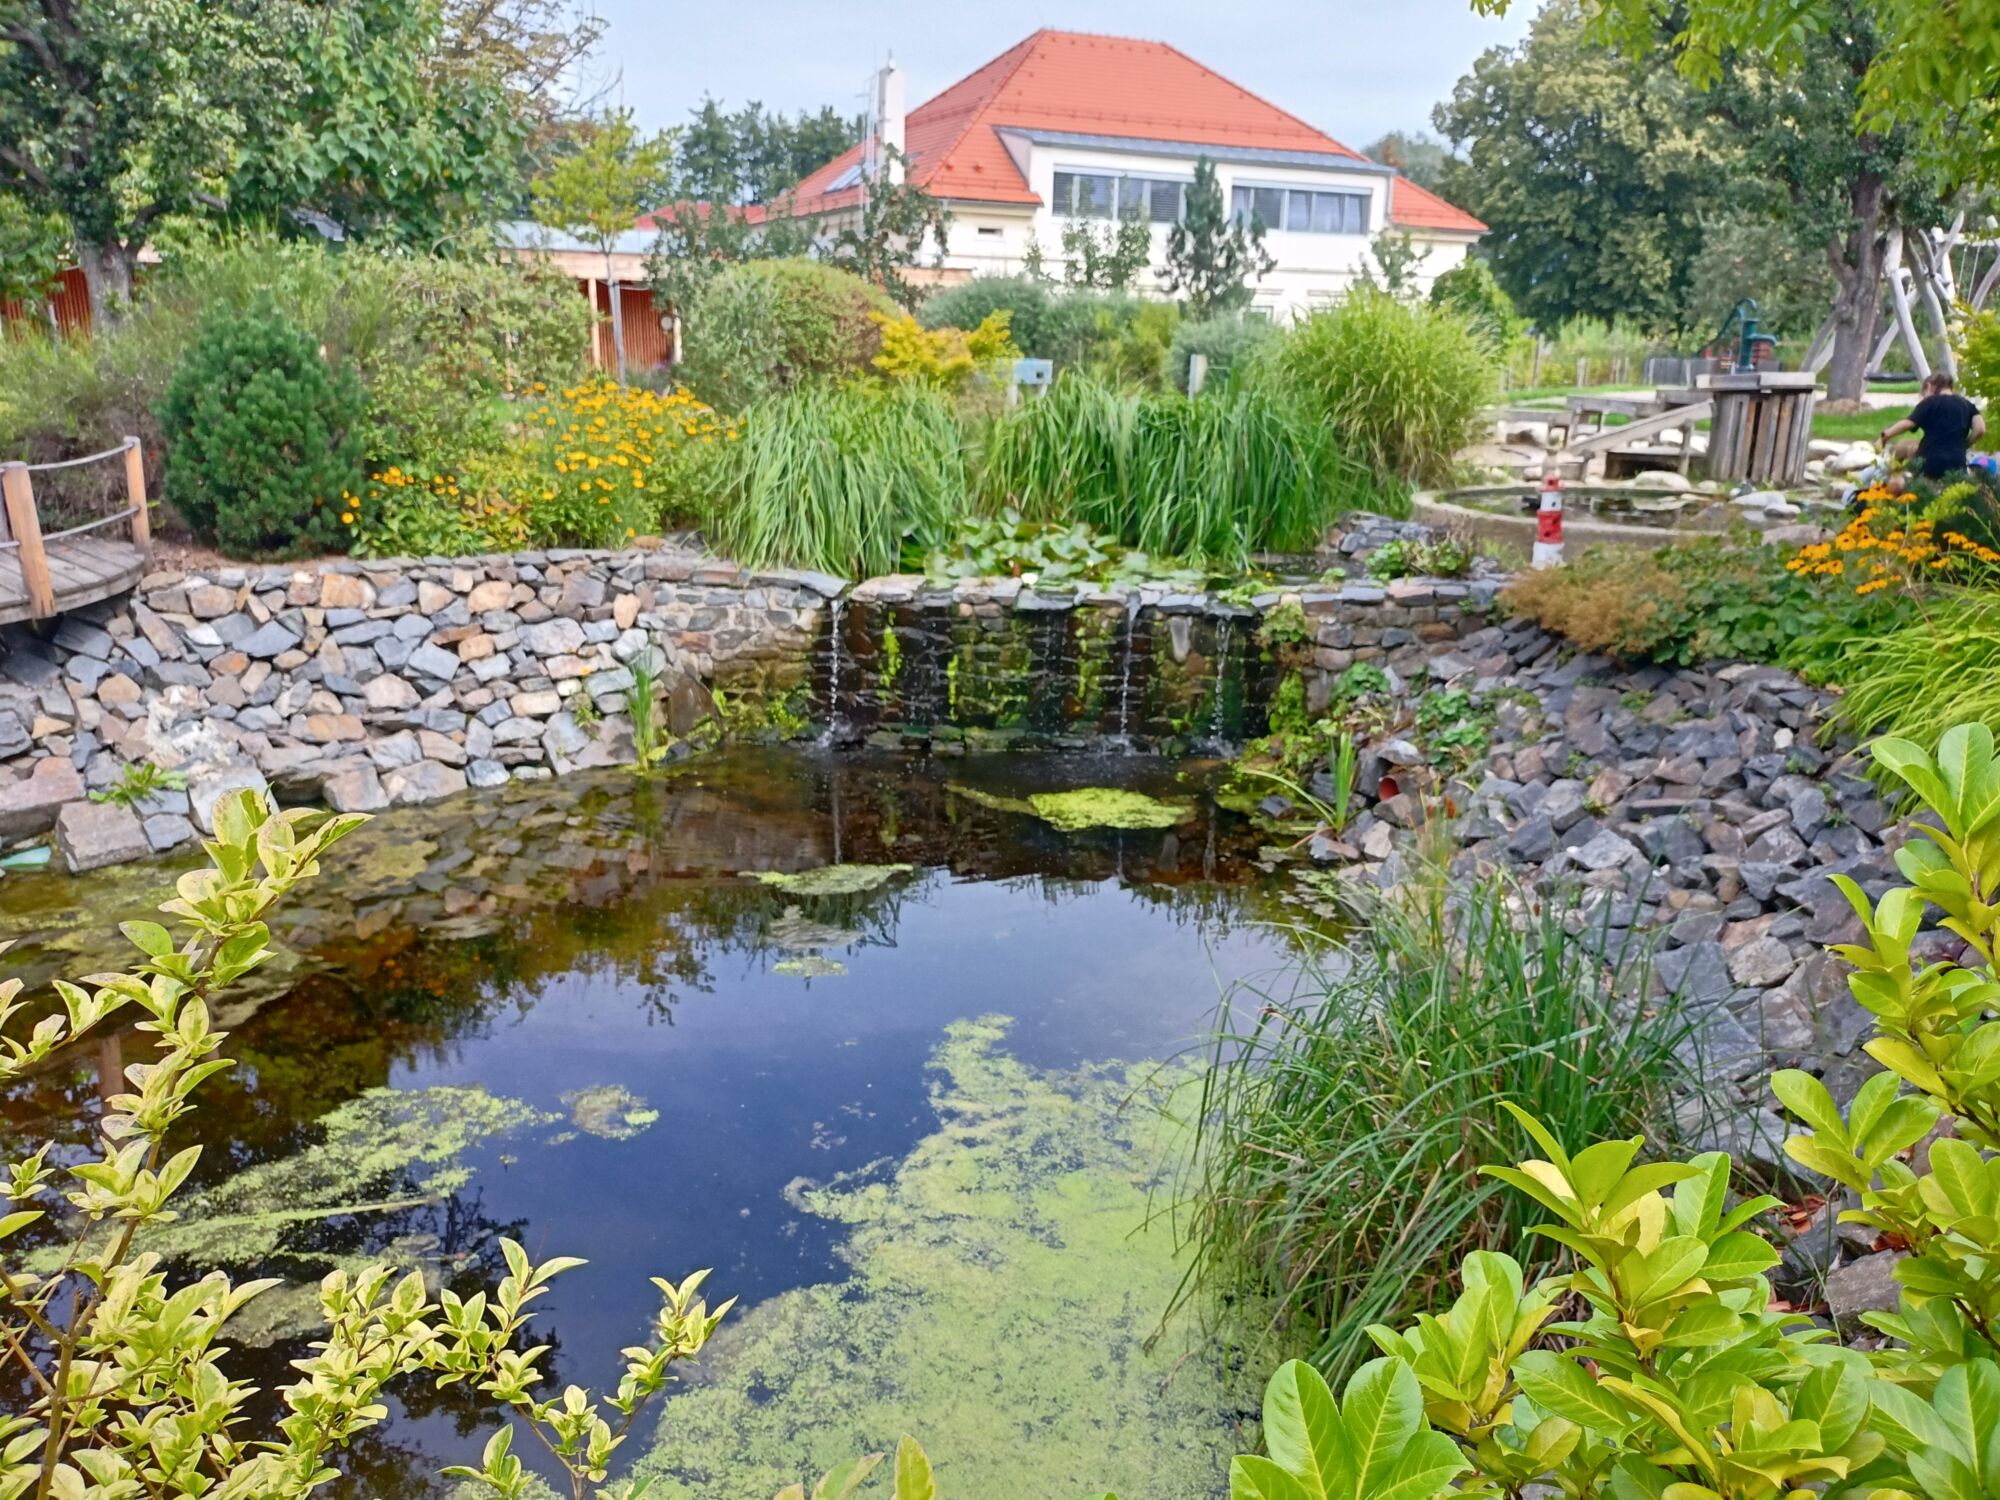
Location: small pond or body of water just large enough to last the season
Season: May–October
Equipment: plankton net, microscope, glass slides, dropper (pipettes), field guides and identification keys for determining algae and zooplankton, Petri dish, fine tea strainer, deep white bowl
Context:
The quality of the water tested can be inferred based on the amount and types of microscopic creatures present. This division is really just indicative for the layman. And it is not at all the case that algae and cyanobacteria seek out cleaner water. It is quite the contrary. The more nutrients water has, the more plankton life you will find in it. Highly eutrophic (oversaturated with nutrients) water is then full of algae and cyanobacteria, but poor for species diversity.
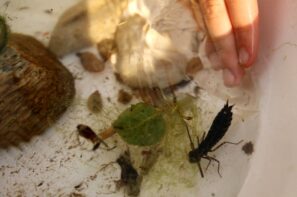
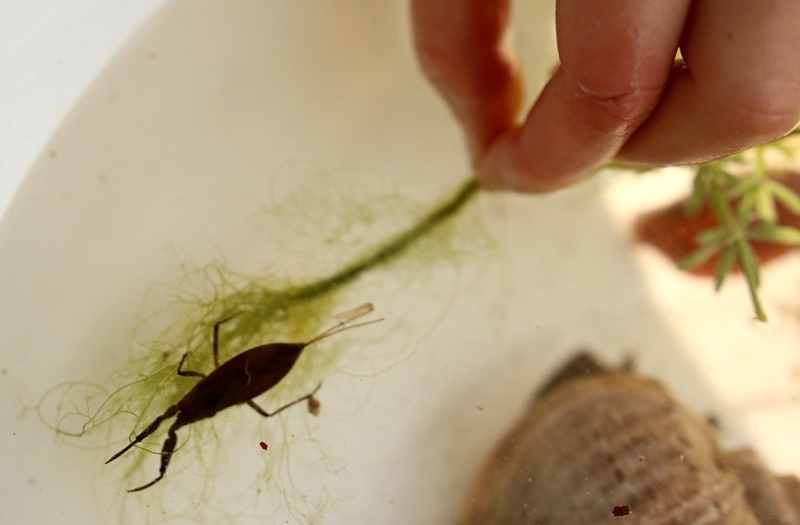
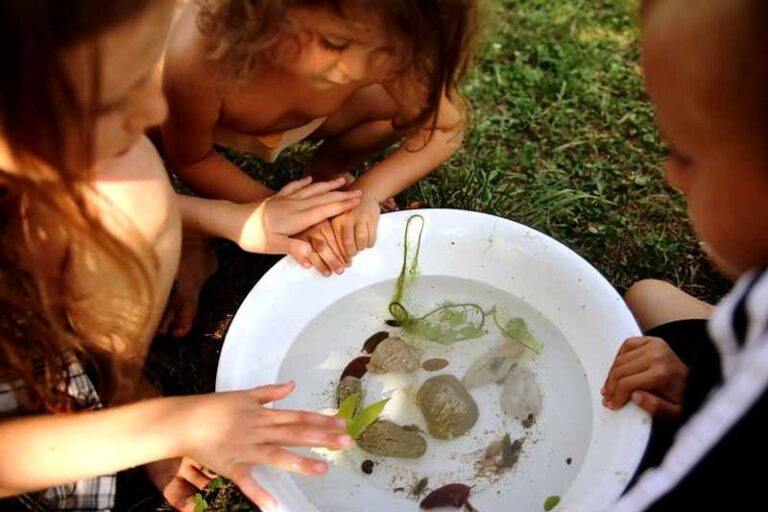
Catch small crustaceans, algae and cyanobacteria on the water surface and in the water column with the plankton net. Wash out the plankton net by turning it inside out and washing the contents into a deep white bowl. The bowl will be teeming with plankton if you repeat this several times. Strain the contents of the bowl through a fine tea strainer and tap it into a Petri dish leaving only a bit of water. You can watch the microscopic critters directly in the Petri dish or transfer them to a specimen slide using a dropper or pipette. Add a cover slip if the slide allows and observe the drop of water with plankton with a microscope. The recommended magnification of the microscope is 10 x 20 to 10 x 40. Be careful not to let the drop of water dry out during the observation. Return the plankton back to the bowl with water after observing.
How do you identify algae, cyanobacteria and zooplankton?
There are many guides which can be taken outside to help identify plankton in the field but it is advisable to search for atlases which are specific for your location. General, all-encompassing guides tend to be in the “tome” size which makes field research difficult.
There are a number of online resources which are quite encompassing but allow for quick referencing:
http://www.phytovre.lifewatchitaly.eu/vre/phyto-list/
https://wcwc.ca/wp-content/uploads/2020/12/Algae-identification-lab-guide.pdf
has great descriptions but might be location specific to Canadian Algae. A good search term is “freshwater Plankton Identification WORKSHEET“ and add your location.
Follow-up questions:
- Where were the most species found (surface, differing depths of the water column, pond, stream, puddle, clean or polluted water...)?
- Which creature caught your attention the most?
- Which species of zooplankton was the largest?
- How does the amount of plankton in the waters develop during the year?
What is the role of plankton in the water ecosystem? What effect does it have on water quality?
WATER BALANCE
There is a water balance and sometimes it rains more than can be evaporated back into the atmosphere and other times the water evaporates completely. Accelerated climate change may not affect the predicted total rainfall too much but we are seeing precipitation distributed differently and more unevenly.
Goal: Pupils compare how much water rains and how much evaporates in different places.
Time: one month but you can also choose a week or even a weekend if need be
Age: older children (10+)
Subject: mathematics, physics, geography, meteorology, hydrology
Location:
Season: we recommend May, June and September
Equipment: a rain gauge or two, oil, a wide bowl or washing up basin, and a ruler
Context:
There is a water balance and sometimes it rains more than can be evaporated back into the atmosphere and other times the water evaporates completely. Accelerated climate change may not affect the predicted total rainfall too much but we are seeing precipitation distributed differently and more unevenly. We can expect periods of excessive rain and flooding as well as longer periods of drought. A prime example was the two-year drought of 2018–2019 which caused the most extensive bark beetle calamity in the history of the Czech forests. Drought poses many dangers in the form of wells drying up and drinking water shortages, threatened wetlands, decreasing water levels of streams and rivers, decreasing oxygen in ponds and lakes affecting aquatic life (also affecting drinking water quality), and an increase in pests (e.g. the bark beetle). Agricultural production is particularly sensitive to drought too as crops do not grow and neither does fodder, there is a lack of water for irrigation and for livestock.
The difference between precipitation and evaporation is called the water balance. Put simply where there is a long-term zero or negative balance there is a desert. All we need to observe water evaporating is a bowl of water. Many factors affect evaporation in nature such as humidity, shade and the rate of tree transpiration (water evaporated through leaves). Let's do some research on this topic.
The water balance also includes collection (runoff on the surface or infiltration through the soil). Water that soaks in or drains off can take longer to evaporate. Our task is to build a landscape in such a way that it will survive both excessive positive balances (abnormal rainfall), as well as rainfall deficits (extreme drought). The children will explore different options for safeguarding the landscape in this experiment. With a demonstration of how water levels work, they will come to understand that building large dams might not be the best solution. That we need to work with the whole landscape.
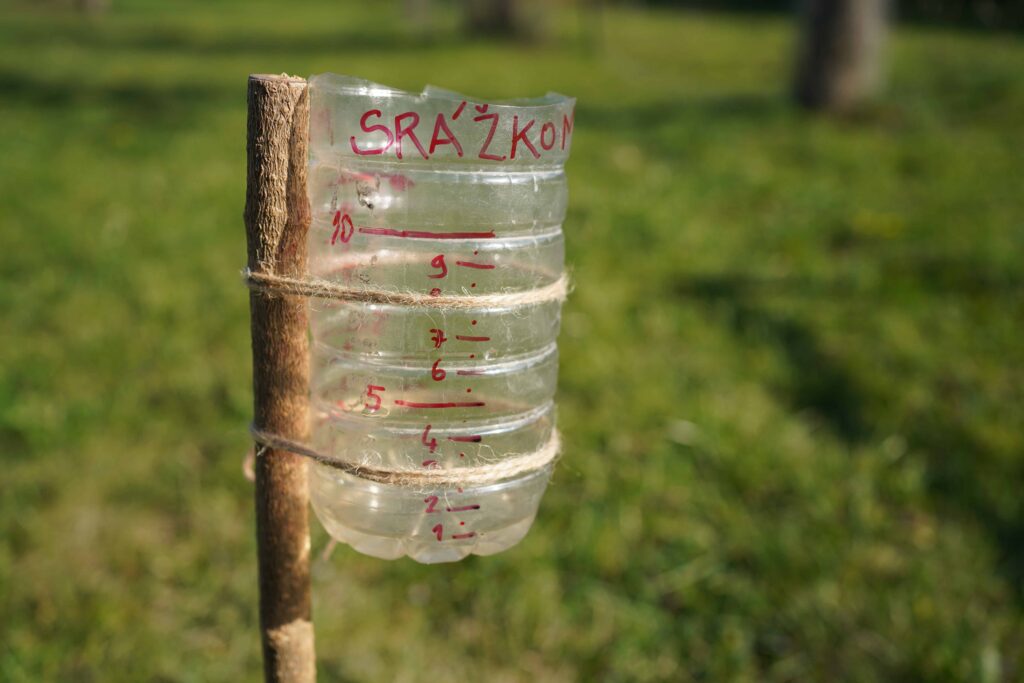
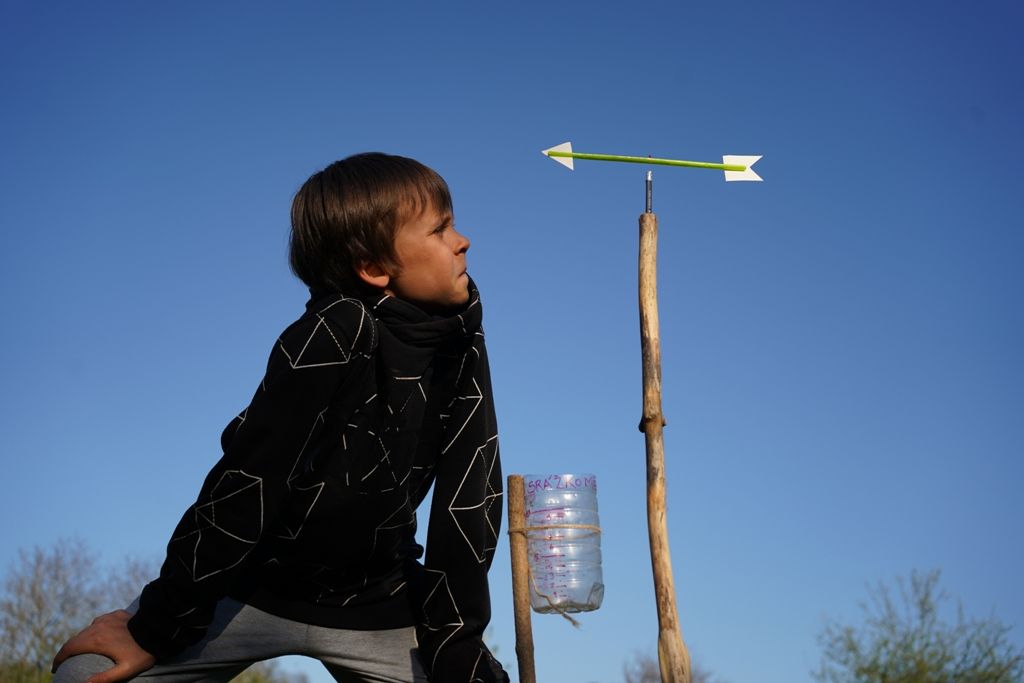
The first step is to determine how much water will rain at your school in one month (we recommend May, June and September) and how much, in turn, evaporates. To begin with you need a rain gauge. This can either be bought or made:
You can build your own rain gauge quite easily with commonly found materials.
Totaliser
There is no need to empty and record measurements of the rain gauge every day. A thin layer of oil on the surface of the water prevents water from evaporating and visibly separates the water level (incident precipitation) from the oil. The oil can then be separated or deducted from the total liquid volume.
We call such a rain gauge a totaliser. You will find this device on mountain tops and inaccessible places which aren’t read every day. These totalisers are being replaced by automatic stations.
Measurement of vapour from the free water surface – an evaporimeter
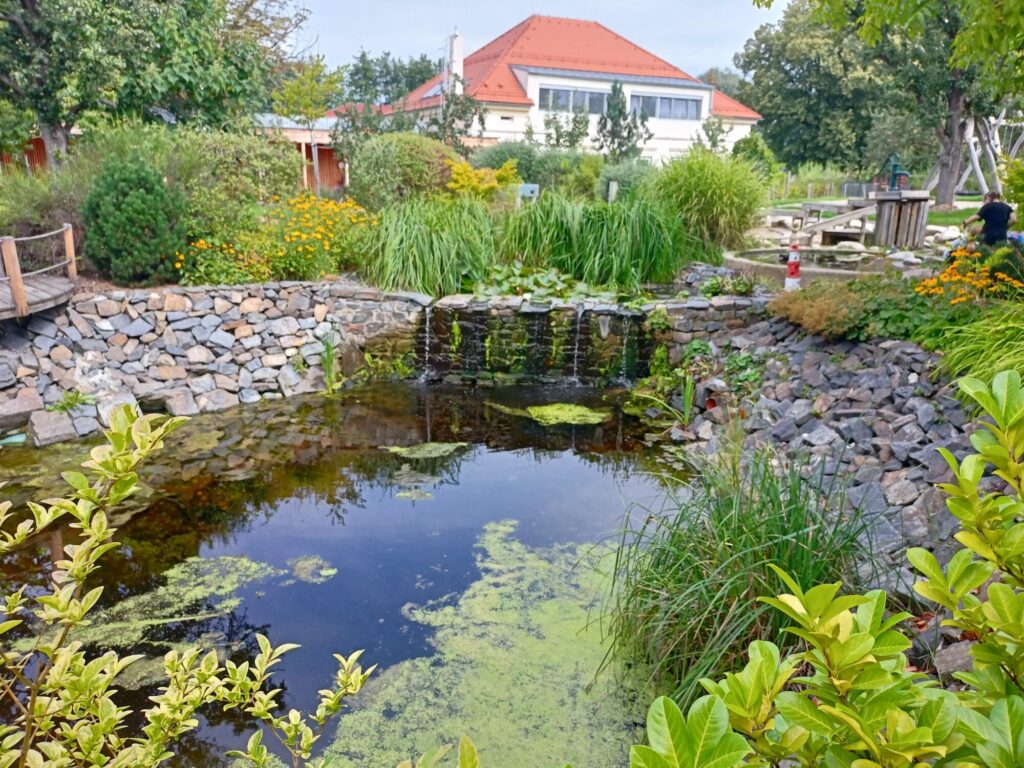
The second step is to measure the local evaporation. A washing up basin or perhaps a deep plate located outside is used to monitor evaporation (because it also rains into it, both precipitation and evaporation are monitored). Such a professional device Is called an evaporimeter. Professional evaporimeters are pools with dimensions exceeding a square metre, so you can also use your pond or a children's pool.
At the end of each week, find the total volume of water:
- how much water fell into the rain gauge (O1)
- how much in total disappeared in the evaporimeter (O2) ... or increased if it rained a lot
- total water evaporated (O3)
We know that: O2 (difference of levels in the evaporimeter) + O3 (evaporation) = O1 (amount of precipitation)
So the final balance is: O3 = O1 – O2
- If O3 > O1, evaporation prevails over precipitation, there is a precipitation deficit.
- If O3 < O1, precipitation prevails over evaporation and the ground is saturated with water.
Place precipitation and evaporation stations both under trees and away from them to monitor the difference between the water balance in the forest and outside the forest.
Keep in mind these results measure the difference between precipitation and evaporation from the free water surface. A device called a lysimeter is required to calculate the transpiration of vegetation (transpiration occurs in a whole forest or even a single blade of grass).
Follow-up questions:
Where does the water that appears in the positive column of our balance sheets go?
- It soaks into the soil, the plants drink it (and subsequently transpire it), it flows over the ground surface...
How do plants cope with a lack of rainfall, where do they get water?
- From the water below the surface, from different depths depending on the type of plant. Soil is a reservoir of water.
Where does the water that rains on the landscape come from?
- From seas and oceans (large water cycle), from forests, fields, meadows and bodies of water (small cycle).
What affects evaporation? (What can decrease it and what can increase it?)
- Air temperature and wind increase it, air humidity decreases it.
MAP RAINWATER SOAK
A big problem in our cities is the management of rainwater. All those parking lots, roofs, concrete surfaces, playgrounds… drain the water into the sewer system.

Goal: Map the rainwater soak around us.
Time:
Age: grades for ages 11–14
Subject: geography, working with a map, mathematics and scale, calculation of area...
Location: school grounds or the entire village, district, larger square, etc.
Season:
Equipment: village map or aerial photograph, mat, paper, crayons, tape, ruler
Context:
A big problem in our cities is the management of rainwater. All those parking lots, roofs, concrete surfaces, playgrounds… drain the water into the sewer system. This is why during a storm the sewers fill up with water very quickly which then rushes into the nearest rivers. This causes water treatment plants to be overwhelmed and presents a very real threat of flash flooding. In addition, because of climate change, we can expect a more varied distribution of precipitation. So while we can expect the total rainfall to remain the same, there will be longer periods of drought and more instances of increasingly heavier rainfall. It is therefore necessary to increase water retention in the cities as well as in the countryside. Cities need more grassy areas, semi-permeable paving and more mature trees that will literally drink up water.
You can find more about weather extremes here: https://www.worldweatherattribution.org/wp-content/uploads/ENG_WWA-Reporting-extreme-weather-and-climate-change.pdf
According to the map, mark out the territory you will map. It should be an accessible place, not surrounded by fences. School grounds, a public space such as a park or square are best. Add the place into your plan, buildings included.
And now distinguish areas where:
1) you collect water for further use (for example, in barrels and underground reservoirs);
2) water seeps into the ground (areas that end up in drains and seepage points, green areas, areas with trees, semi-permeable parking lots or paved sidewalks, sand and gravel surfaces...);
3) the rainwater drains into the sewers (surfaces of roads, asphalt parking lots...).
Find the total area of the individual plots of type 1–3. Try to suggest how to turn the places marked with the number 3 into permeable or semi-permeable surfaces, or how to collect water. You can find ideas for solutions on the internet.
More ideas:
What volume of water will fall on one square metre of area if it rains 1 mm? Find out experimentally, or do the maths.
Find out when it rains how much water falls under the trees and how much in open spaces. How much precipitation does a tree retain?
In the case of heavy rain, try to measure its intensity: amount of precipitation (mm) per hour. In a big storm, measure how long it rains, and after the rain, measure the amount of precipitation. Divide by the number of hours of rain to get the hourly rainfall.
The brave researchers can go out into the rain and watch the change in rainfall every ten minutes and multiply by six to get the current hourly intensity.
Forecasts of such rains should be found at your national weather office. Precipitation at specific meteorological stations can be found in some applications which you can download.
Compare the actual amount of precipitation with the Aladin forecast models used by such sites as wunderground.com and YR.no.
Follow-up questions:
How much water drains from the roof (parking lot, playground...) of your school per year? You can find out the amount of precipitation in your municipality online.
Find out where rainwater drains from your property. Go to your local municipal office, get documents and map the path of the rainwater to the nearest river or body of water.
WATER IN THE SOIL
Soil water is critical to water retention in the environment. Soil that is too wet, too dry or otherwise damaged (compacted, damaged by erosion or lacks a humus component), is not able to retain water.

Goal: Test which soil type holds the most water.
Time:
Age: children 12+
Subject: geography and natural history, pedology, physics, mathematics, research
Location: different locations around the school that varied in terms of characteristics and types of soil
Season:
Equipment: spades, small (0.5l) pet bottles with necks removed and bottoms perforated, sampling dishes, aquarium, scales, measuring cups
Context:
Soil water is critical to water retention in the environment. Soil that is too wet, too dry or otherwise damaged (compacted, damaged by erosion or lacks a humus component), is not able to retain water.
Here we present several experiments which should help to demonstrate soil water content, water capacity, or absorption and buoyancy force of soil. For help, we look to the old, but irreplaceable, manual, Biological Experiments in School (H-W. Baer: Biologische Versuche im Unterricht (1960)).
Soil water capacity (experiment lasts two days)
Water the soil in any given location thoroughly with water from a sprinkler until the soil is saturated. Cover the test site and take a soil sample from the site the next day. Measure the sample's mass. Next, dry the sample in the sun (or use a dehydrator) and weigh it once more. Calculate the difference in measurements and convert that to a percentage to find the water capacity. Here is a table which will help to determine the approximate soil type based on water capacity.
Table of full water capacity according to Mitscherlich (how much dry soil will increase in weight when fully saturated with water)
Type of soil Full water capacity
Sandy 18.8%
Sandy loam 20.2%
Sandy with humus 52.8%
Clayey 80.9%
Peat 126.0%
Water absorption of soil (experiment lasts 45 minutes)
Measure water absorption in exactly the same way. Collect fresh soil samples from selected locations and weigh them. Place the soil samples into the perforated PET bottles and immerse them in an aquarium with water so that the level is at the level of the sample (you can weigh down the bottles with stones so they don't float). When the soil in the bottles is completely saturated with water, take them out and let them drain any excess water from the bowl. Now weigh the sample again (including the PET bottle, whose weight will later be subtracted) and calculate the difference to determine current soil permeability.
Follow-up questions:
Why is soil important in nature for water management?
Which soil holds more water: sandy, loamy or clayey?
Why are peatlands important and why is peat mining prohibited? (In natural gardens it is prohibited to use peat.)
Soil buoyancy (experiment lasts 60 minutes)
Find out how fast water rises through different types of soil. Again, small PET bottles with perforated bottoms are used which are filled to the brim with selected soil samples. Shake off stray particles with a few hits on the table top and to eliminate any air pockets. Place all the sample bottles in a bowl with water at the same time and top up the water when the soil drinks it up. Find out how high the water in the bottles rises in 5 / 10 / 15 / 20 / 30 and 45 minutes. Either write the results in a table or make a graph or both.
Water rises from the lower layers to the higher ones due to buoyancy. In coarse-grained samples, it first rises faster than in fine-grained samples, but in a short time water overtakes it in fine-grained samples.
Follow-up questions:
How important is buoyancy in soil to vegetation?
Compacted soils have poor buoyancy and absorption capacity. What damaged the soil?
When is buoyancy more important: when it is rainy or dry?
Do you know how high water can rise in the soil? (Up to 40 cm in sandy soils and up to 100 cm in clay soils.)
Permeability of the soil for water (experiment lasts approx. 30 minutes)
Another important quantity is permeability. You find it by hanging perforated bottles with freshly taken samples over measuring cups and pour 200 ml of water into each bottle. Monitor how long it takes for the first drop to drip, the amount of water dripped at 5 / 10 / 15 and 20 minute intervals as well as the time when the seepage stops.
Follow-up questions:
Are absorbance and permeability in direct or inverse relation to each other?
Try colouring the water you pour into the soil with ink. It discolours on the way, why is that?
How is a high water retention of the soil beneficial in the rainy season and how in the dry season?
SHARE YOUR EXPERIENCES AND WIN OUR E-BOOKS
Choose 3 water challenges and email us your experiences or send pictures at team@lessonsingrass.com
The prize draw that will take place on June 7, 2023 and 3 lucky winners will be selected to receive our e-books:
The Playful Herbarium
Laboratory Spring/Summer
Trees I: Experience and Love

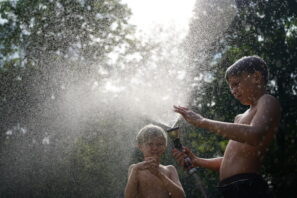
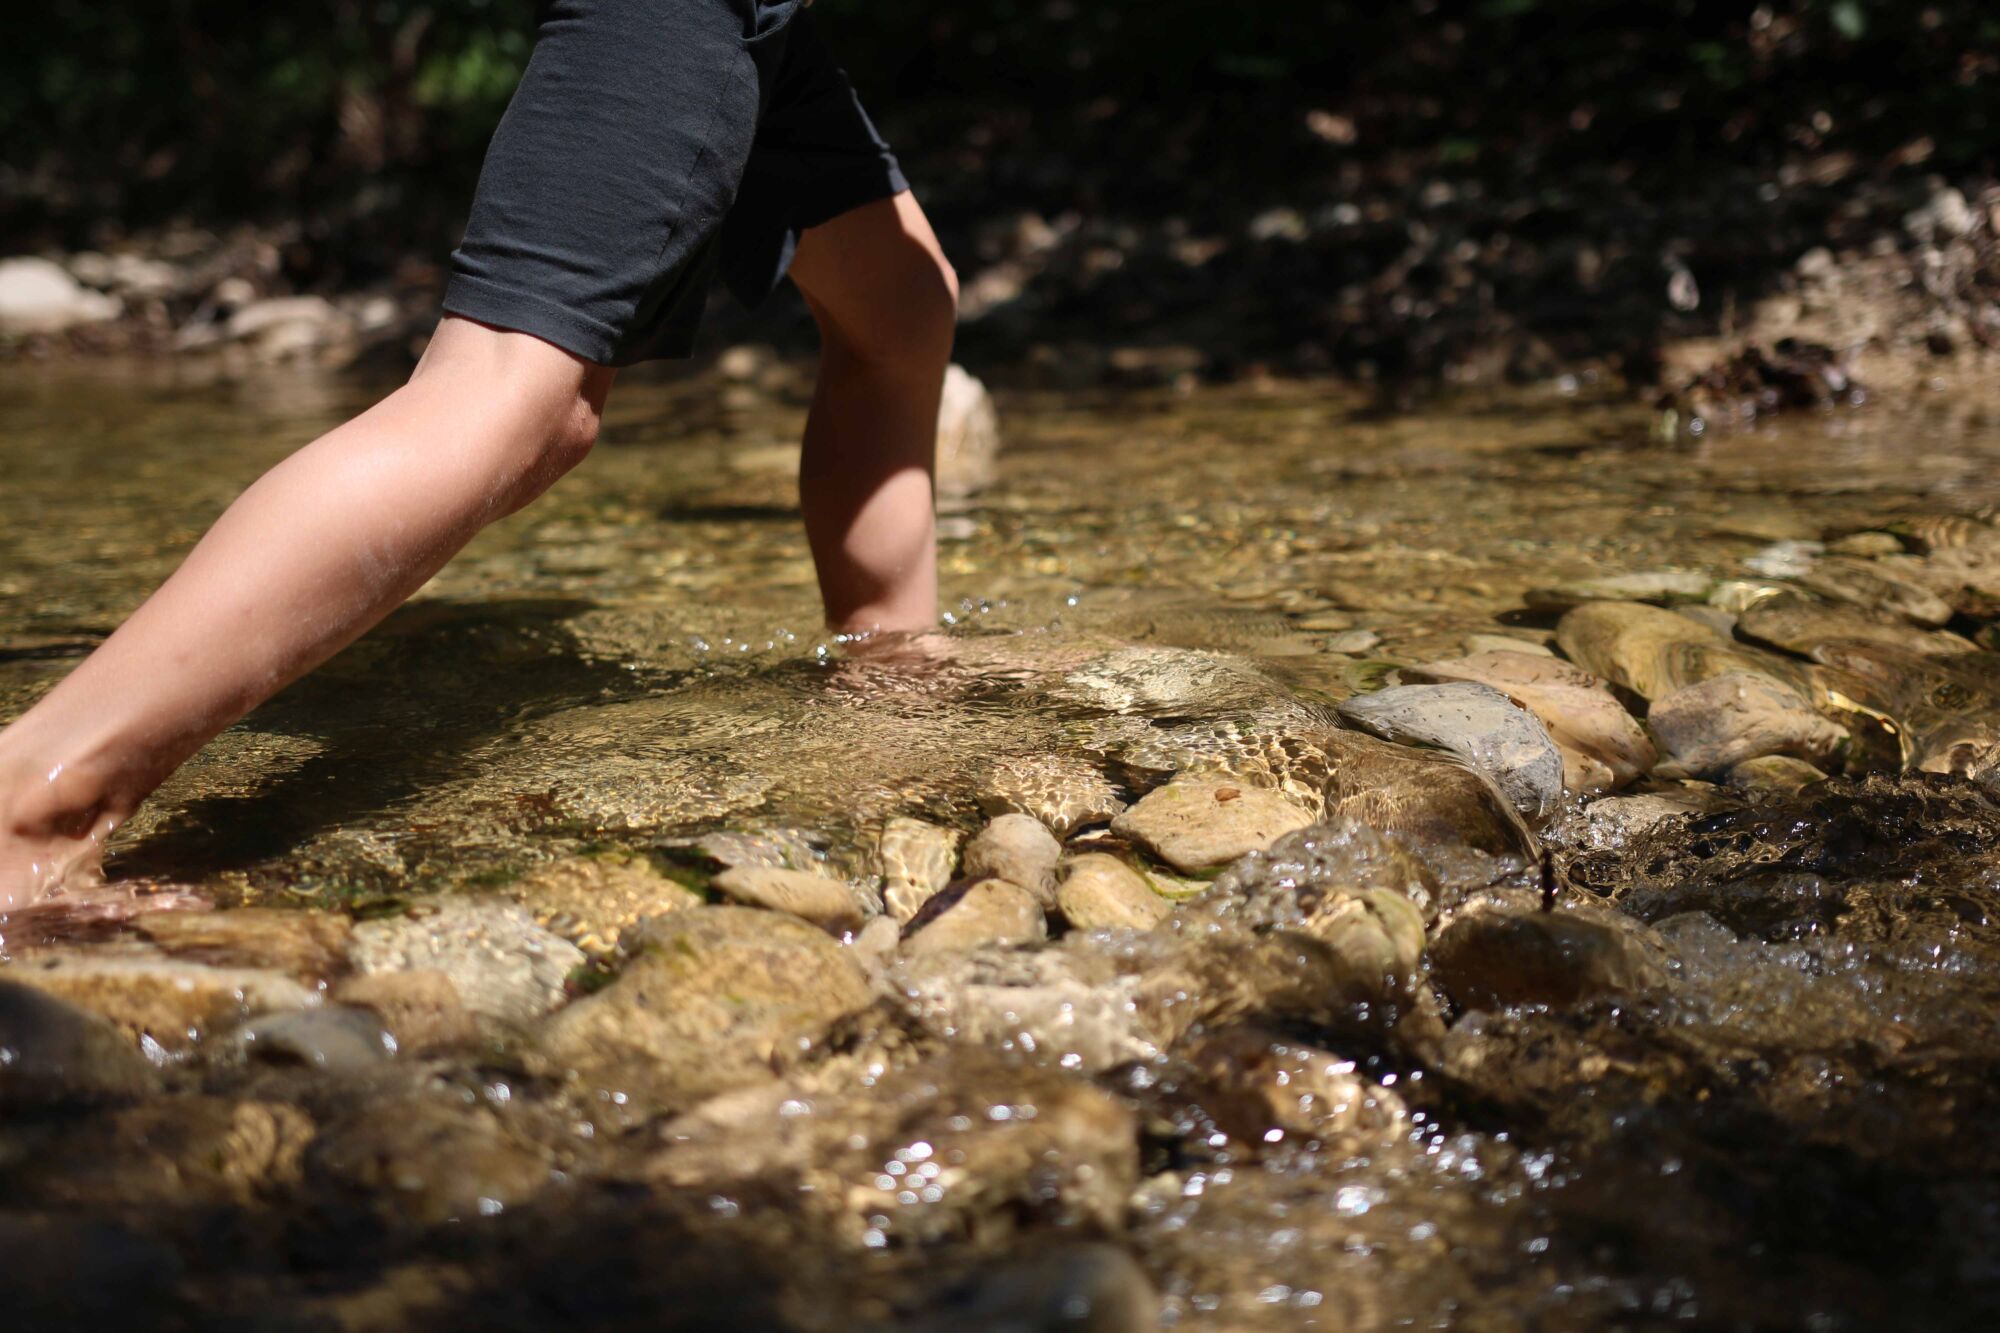
WATER OUTDOORS
Expeditions to explore water develop our sensitivity
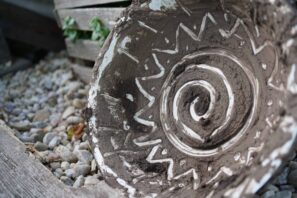
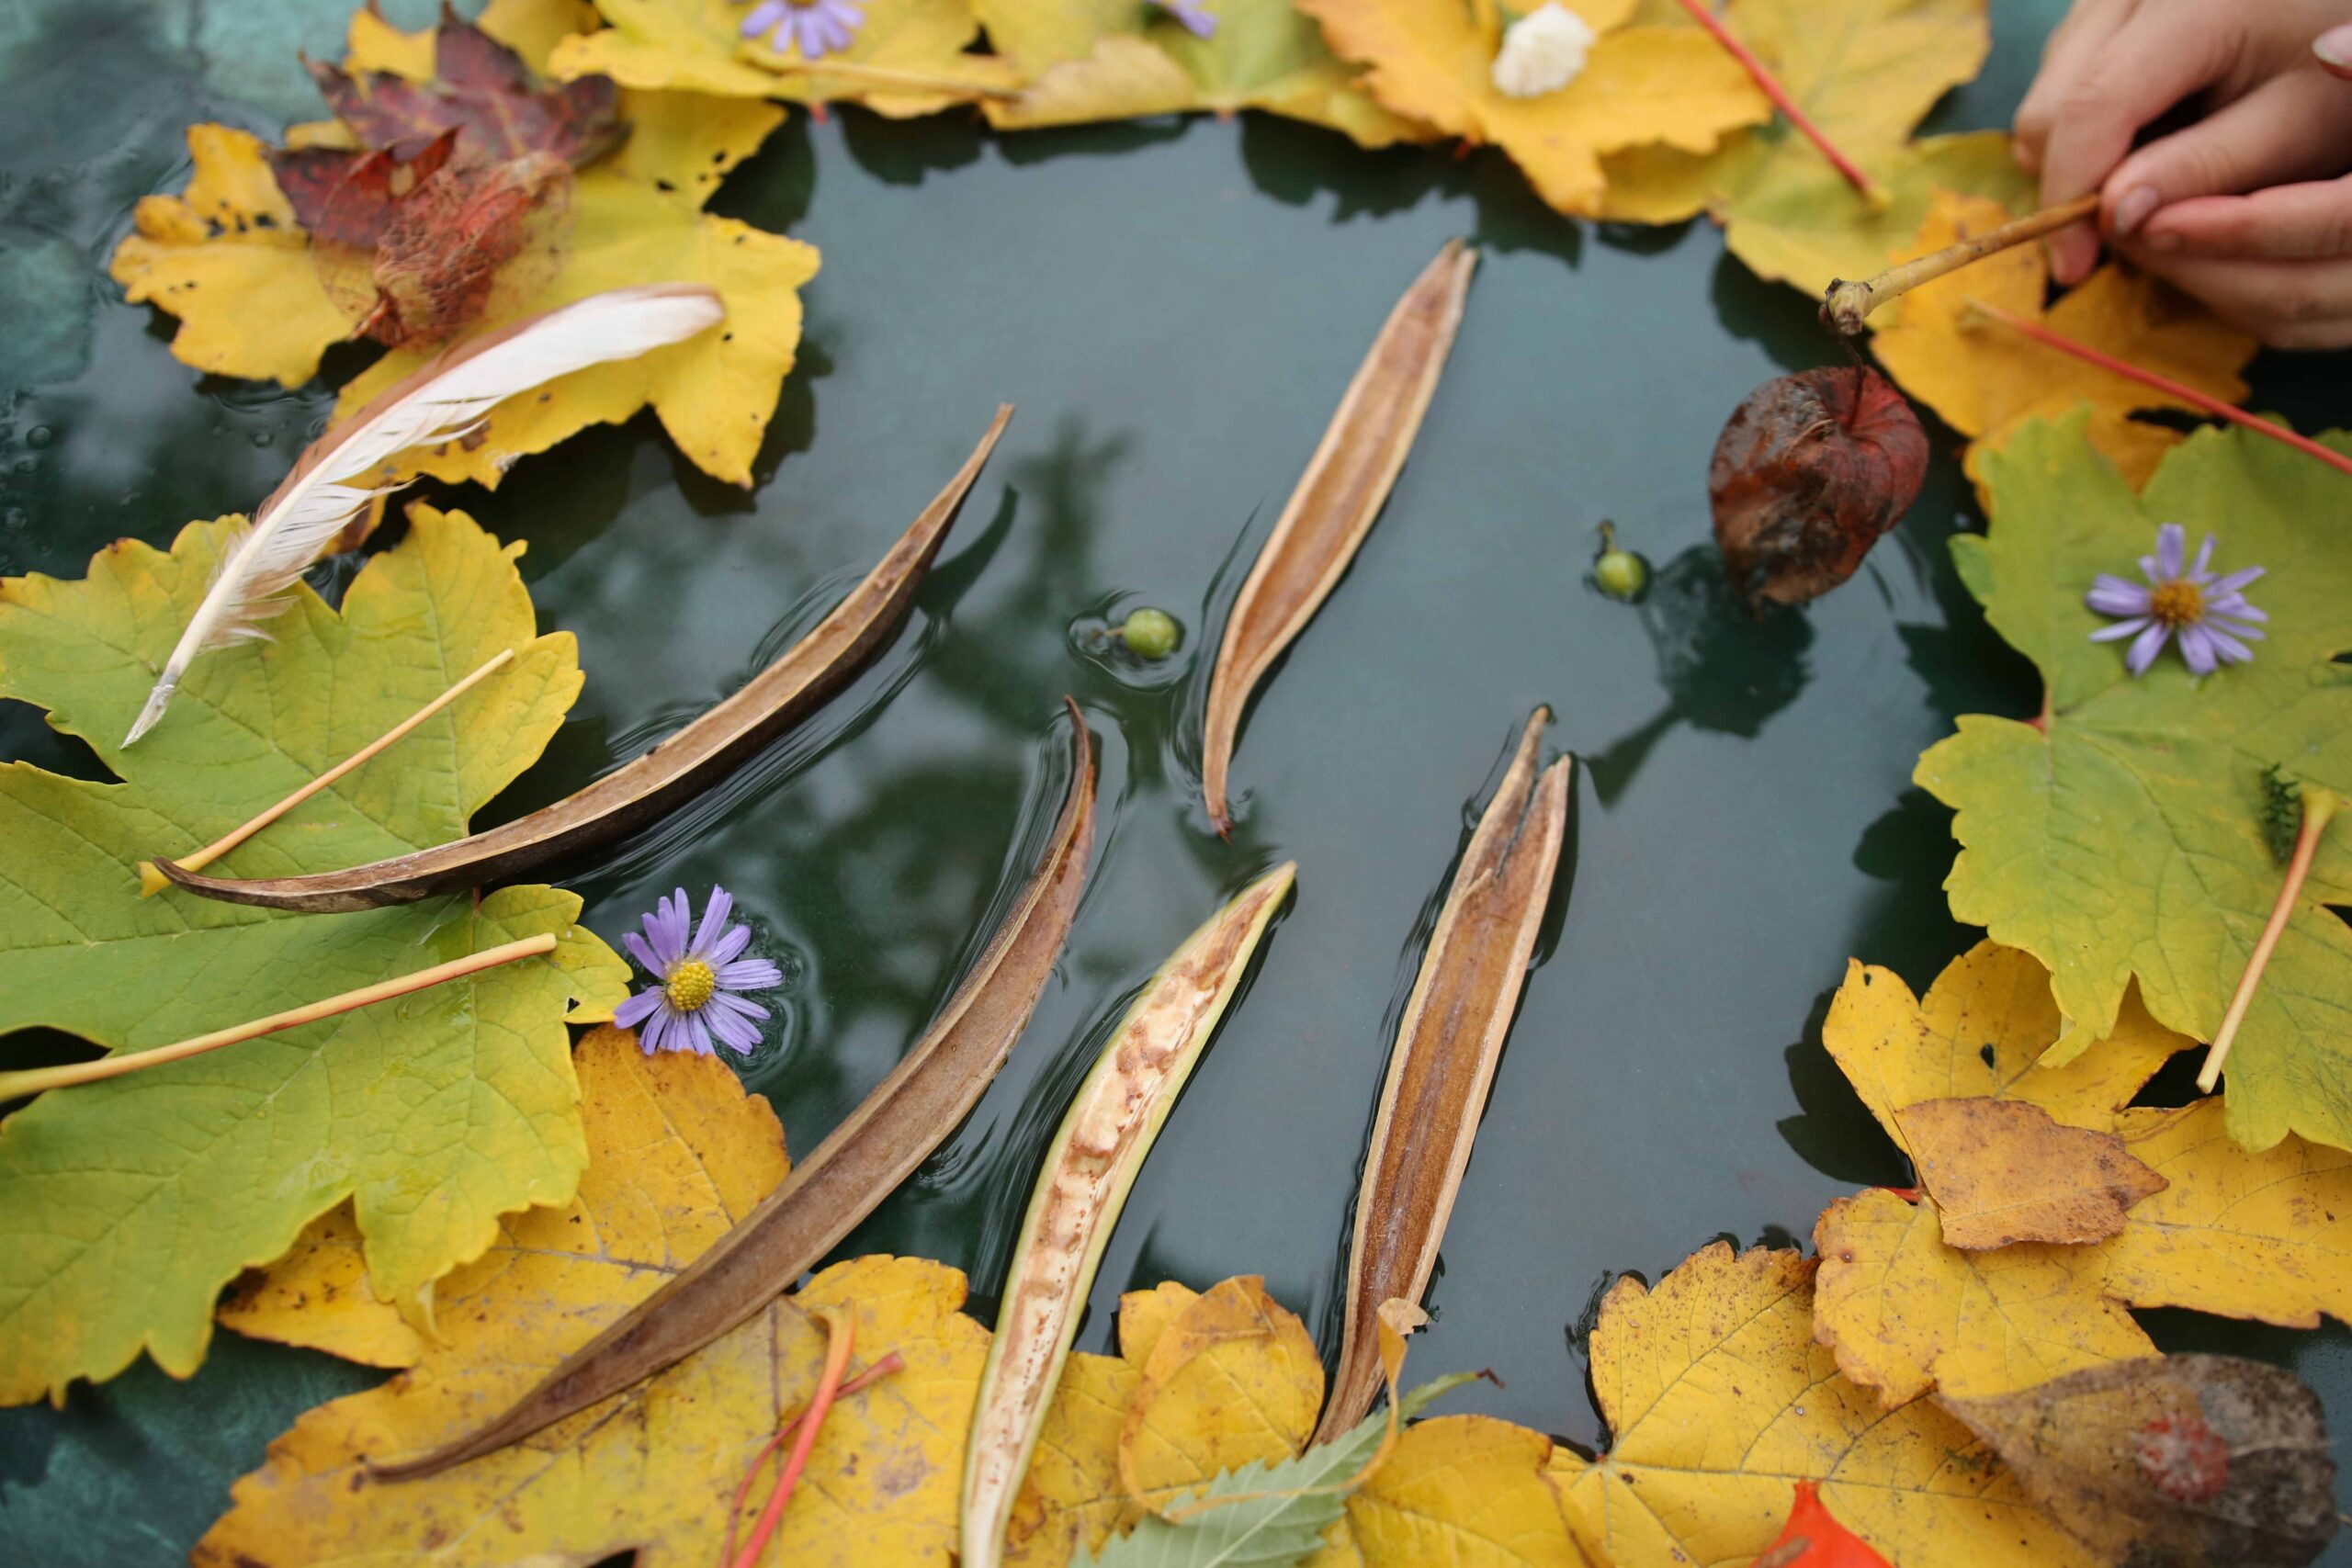
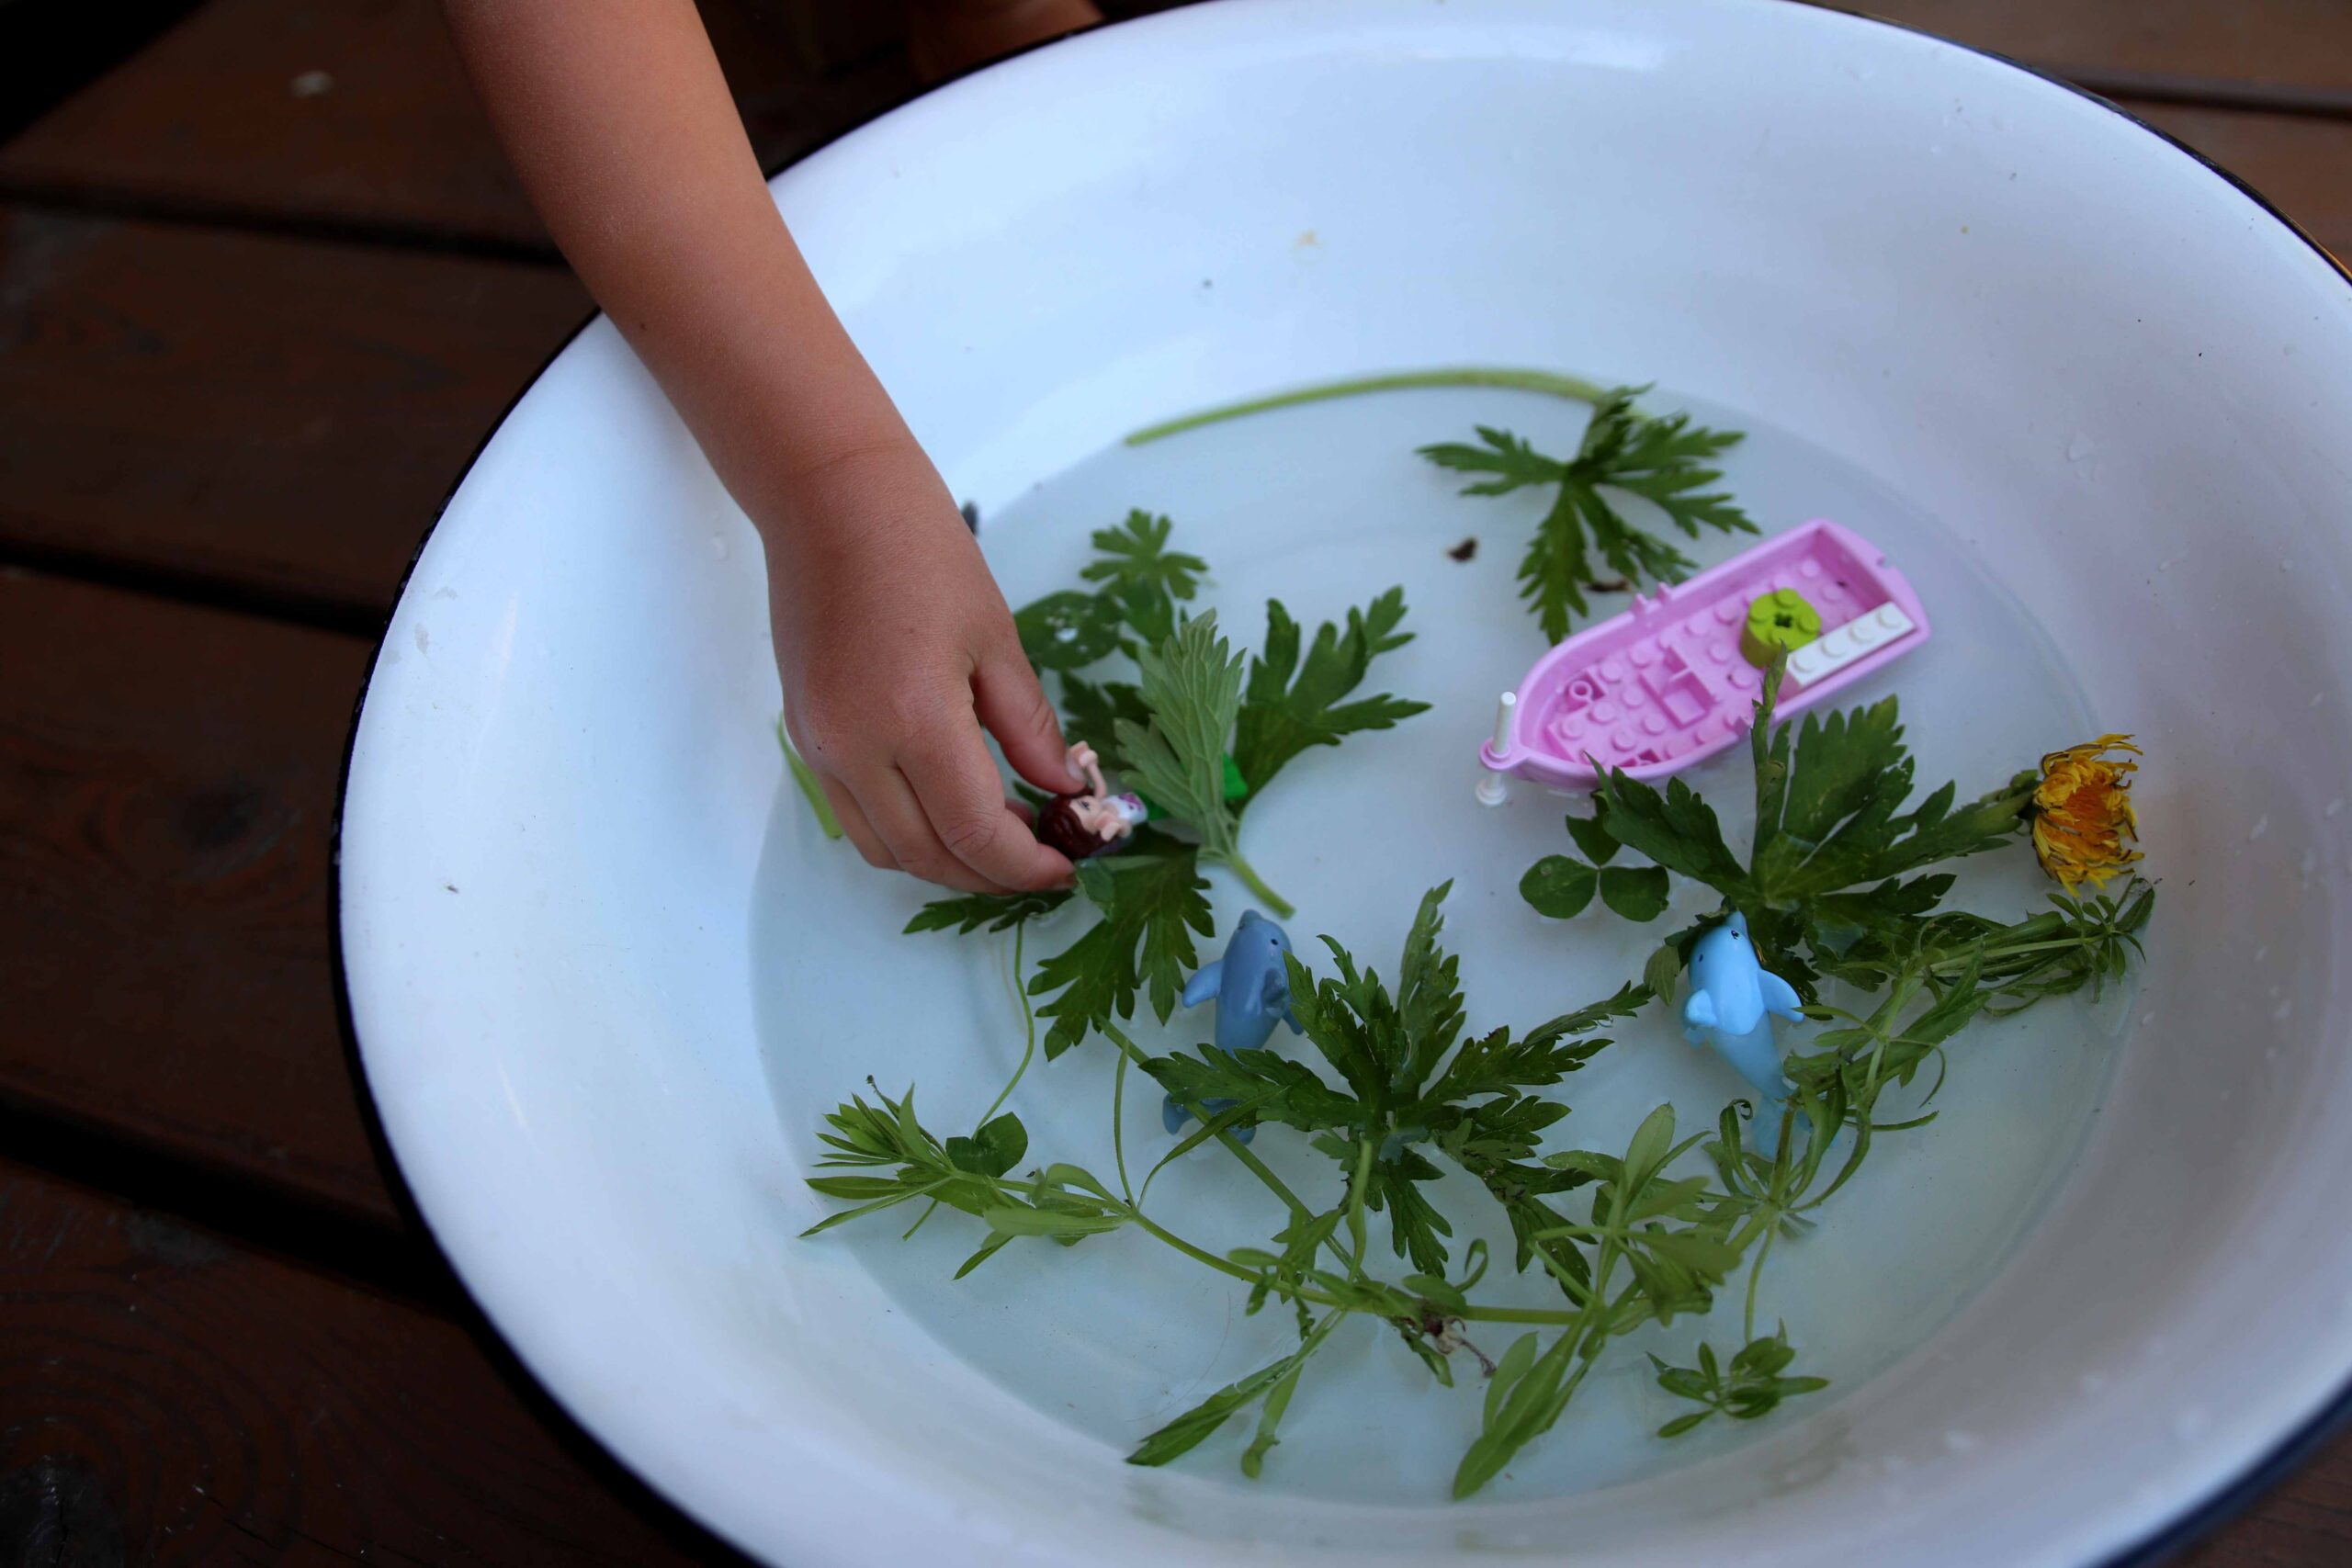
CREATE WITH WATER
Creating with water outdoors opens up the imagination
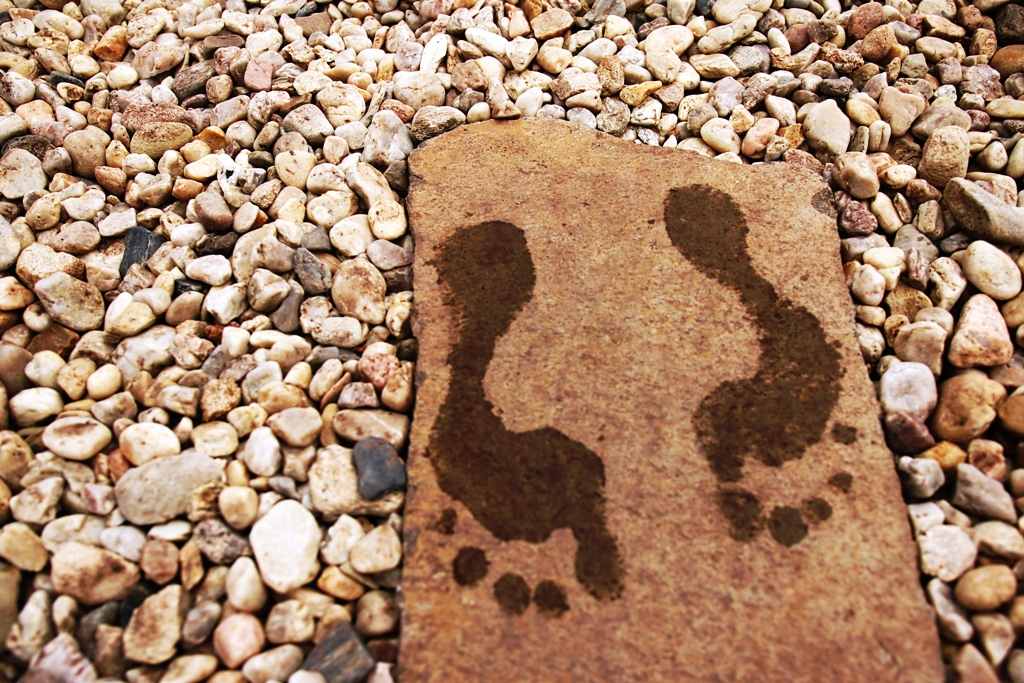
EXPLORE WITH WATER
Discover the mystery and uniqueness of water in practice

SCHOOL GROUNDS MONTH IS BROUGHT TO YOU BY

ANNA Fischerová
networker, methodologist, creator, tester, actionwoman, coordinator

TEREZA Boháčová
methodologist, creator, tester, critical eye, coordinator, visionary

ADÉLA Hamplová
lecturer, practitioner, creator, tester, networker, actionwoman, teacher


JUSTINA Danišová
creator, lecturer, teacher, lesson author and tester, dreamer


ALENA and KEN
Schagen
an amazing translation team who translates and fine-tunes our texts into their final shape

GET INVOLVED
Share your experiences, videos, photographs, results, advice and questions here:
on Facebook
by e-mail at team@lessonsingrass.com
WE WANT TO GET CHILDREN OUT
We can help you on the way out too